
Evaluation of the Colorectal Cancer Screening Program for the 2012–2013 Period: National Indicators
Note: The guaiac test (Hemoccult® II) was replaced by the immunoassay (OC Sensor®) in April 2015. The indicators presented for the 2012–2013 period refer to the guaiac test (Hemoccult® II).
A description of the indicators is available in the Guide to Data Formats and Definitions of Indicators for the Evaluation of the National Program
Indicators of Screening Test and Diagnostic Test Quality
This subsection presents quality indicators for screening tests and diagnostic examinations for the 2012–2013 period, including the rate of individuals with at least one unanalyzed test, the rate of individuals with an unanalyzed test that was not retested, the rate of positive tests, the percentage of colonoscopies performed…
The national quality indicators for screening tests and diagnostic examinations are shown in the table opposite: xls format and pdf format
Additional information:
Percentage of people who underwent a colonoscopy following a positive test
According to European recommendations1
the percentage of people undergoing a colonoscopy after a positive test
the acceptable level is 85%
the desirable level is 90%
The percentage of complete colonoscopies (entire colon and rectum examined):
the acceptable level is 90%
the target rate is 95%
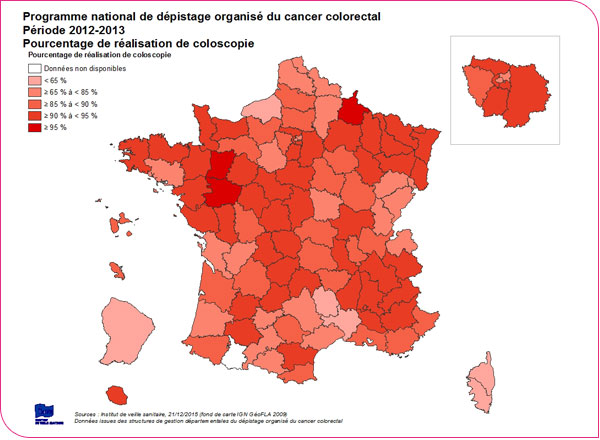
During the 2012–2013 period, 89,917 colonoscopies were performed following a positive screening test, which corresponds to a colonoscopy completion rate following a positive test of 87.1%. This figure is slightly higher than the recommended European level. The colonoscopy completion rate varies by department from 62% to 94.8% (5th and 95th percentiles): it is particularly low in five departments (Corsica, French Guiana, Seine-Maritime, Lozère, and Gard). This low colonoscopy completion rate is likely linked to insufficient medical coverage in certain areas, resulting in longer wait times, as well as the incomplete reporting of this information to administrative bodies—likely due to uneven engagement among healthcare professionals.
Percentage of people who underwent a colonoscopy following a positive test
Quality of the colonoscopy
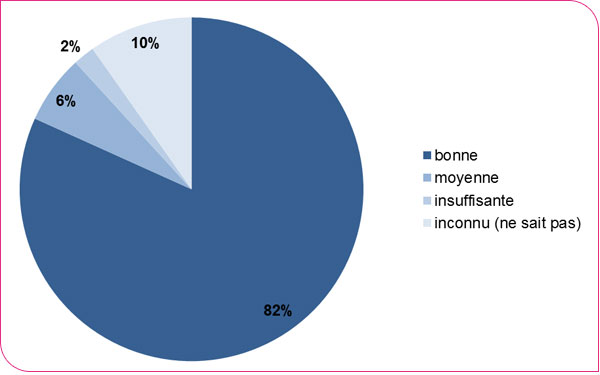
The quality of preparation for the colonoscopies performed was rated as good for 82%, average for 6.0%, and insufficient for 2% of the exams. Information on the quality of the colonoscopy was missing for 10% of the exams.
Distribution of colonoscopies performed by quality of preparation
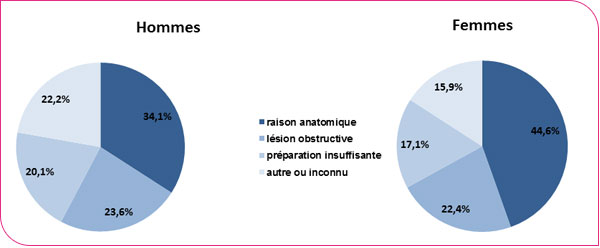
The percentage of people who underwent a complete colonoscopy is 93.3%. A colonoscopy is considered incomplete when the entire colon and rectum are not examined during the procedure. The reasons cited for incomplete colonoscopies vary by gender: 36% of cases were due to anatomical reasons among men versus 46% among women; 35% among men were due to obstructive lesions versus 28% among women. Other reasons included insufficient preparation or an unspecified reason.
Distribution of incomplete colonoscopies by reason
Morbidity of colonoscopy
The completeness of data collection on colonoscopy complications, particularly deaths occurring in the days following the procedure, is not guaranteed at the national level. The variable tracking colonoscopy incidents and accidents has 54.2% of data entries left blank, making it impossible to determine whether the information is missing or if the colonoscopy proceeded without complications. These statistics cannot therefore be presented. More detailed analyses must be conducted on this subject.
1 Segnan N, Patnick J, von Karsa L (eds). European guidelines for quality assurance in colorectal cancer screening and diagnosis. First Edition. Luxembourg: European Commission, 2010.
Program monitoring indicators
This subsection presents program monitoring indicators: the time taken to perform a colonoscopy and the percentage of lost-to-follow-up cases for the years 2012–2013.
Distribution of time to colonoscopy
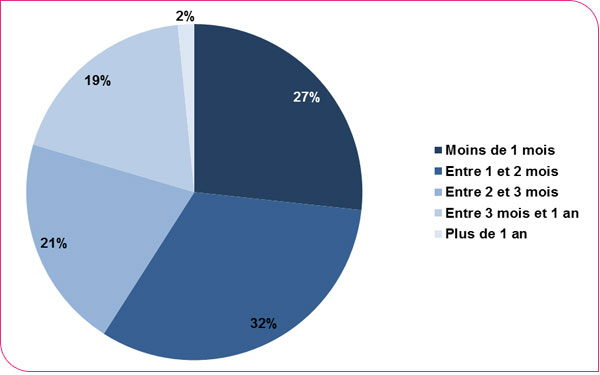
The distribution of wait times for colonoscopies following a positive test shows that only 26.7% of colonoscopies are performed within 31 days, in accordance with European recommendations. The median wait time is 59 days and varies by department from 47 to 82 days (5th and 95th percentiles): the shortest median wait times are observed in the departments of Alpes-Maritimes, Gers, Finistère, Pyrénées-Orientales, and Ardennes, and the longest in the departments of Calvados, Oise, Martinique, Deux-Sèvres, and Vienne (xls format and pdf format). While these wait times may reflect the level of motivation among those who tested positive to continue with the diagnostic process, they also reflect the wait times for obtaining an appointment. This significant delay can be a source of additional anxiety for patients.
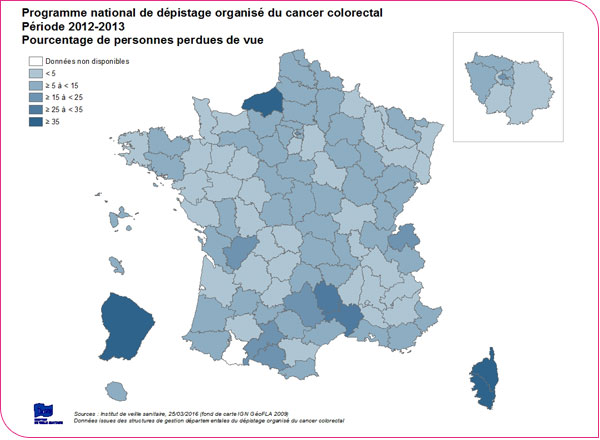
Geographic distribution of the percentages of patients lost to follow-up
A person is considered a "lost to follow-up" case when the managing organization is unable to obtain any information about that patient 24 months after the test was performed. The percentage of "lost to follow-up" cases is 8.2% (8.7% among men and 7.5% among women) for all departments participating in the program. This percentage varies by department: less than 1% for the departments of Ardennes, Yonne, Gers, Mayenne, Meuse, and Alpes-de-Haute-Provence, up to 44.3% and 55.1%, respectively, for the departments of Corsica and Seine-Maritime. It is also high in the departments of the Gers (26.3%), Lozère (30.6%), and French Guiana (36.7%). These departmental disparities reflect the heterogeneity of documentation within management structures regarding test follow-up (for example, the transmission of information by healthcare professionals to the management structure is more or less systematic).
Indicators of detected lesions
This subsection presents indicators of detected lesions for the 2012–2013 period. These indicators pertain to the nature and rates of lesions detected (adenomas, advanced adenomas, and cancers) through diagnostic examinations (colonoscopy or other methods).
The detection rate for advanced adenomas (and colorectal cancers, respectively) is defined as the proportion of patients in whom an advanced adenoma (or cancer, respectively) is the most serious lesion detected, among those who underwent an analyzable screening test. It is expressed per 1,000 (‰) screened individuals.
The detection rate of advanced adenomas varies depending on the definition used: it is (i) 2.5‰ when an advanced adenoma is defined as an adenoma 10 mm or larger, (ii) 3.1‰ when it is defined as three or more adenomas, or adenomas 10 mm or larger, or adenomas with high-grade dysplasia, (iii) 3.3‰ when defined as an adenoma 10 mm or larger, or exhibiting high-grade dysplasia, or a villous component (XLS format and PDF format).
The rate of advanced adenomas is higher in men than in women; it increases with patient age and is higher during the first screening than during subsequent screenings (see figures below).
Distribution of the detection rate of advanced adenomas by age, sex, and screening round (adenoma 10 mm or larger)

Distribution of the detection rate of advanced adenomas by age, sex, and screening round (number of adenomas greater than or equal to 3, or size greater than or equal to 10 mm, or presenting high-grade dysplasia)

Distribution of the detection rate of advanced adenomas by age, sex, and screening level (adenoma 10 mm or larger, or with high-grade dysplasia, or a villous component)

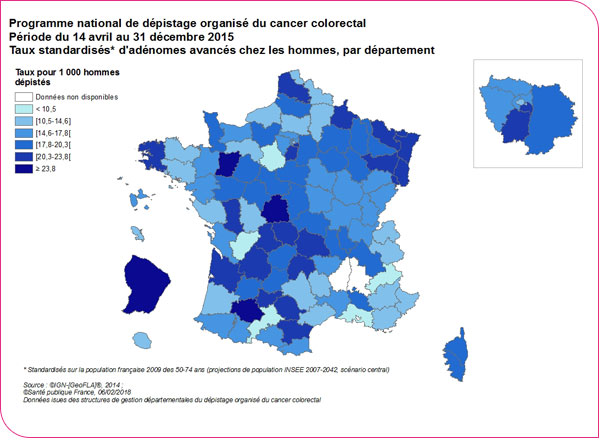
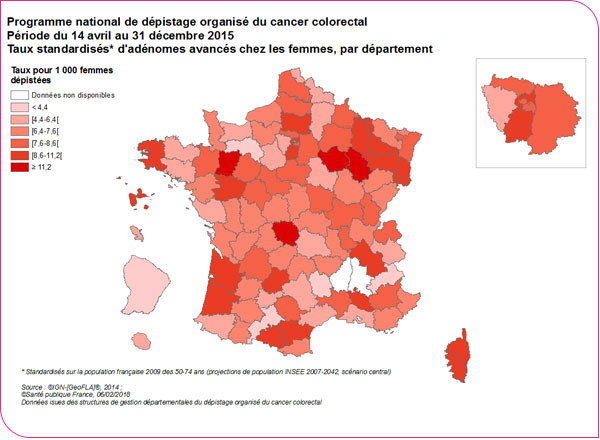
The detection rate of advanced adenomas (adenomas 10 mm or larger, or with high-grade dysplasia, or villous components) varies by department from 2.1‰ to 6.9‰ among men and from 1‰ to 3‰ among women (5th and 95th percentiles) (xls format and pdf format).
Detection rate of advanced adenomas for men
Detection rate of advanced adenomas for women
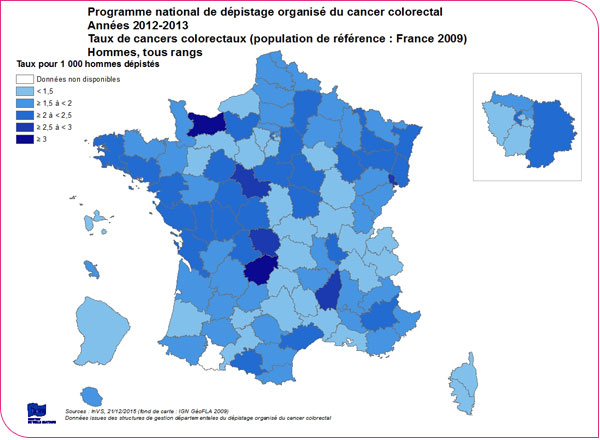
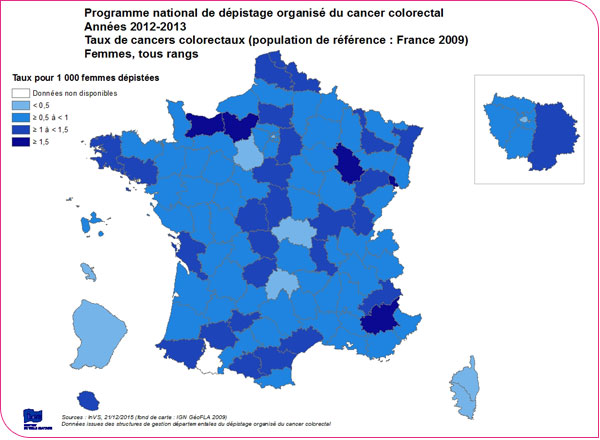
The cancer detection rate is 1.3 per 1,000 people screened. It varies by age, sex, and screening round. For women, it is 1.0‰ during the first screening and 0.8‰ during subsequent screenings, whereas for men, it is 2.0‰ and 1.7‰, respectively—twice as high (XLS format and PDF format). It also varies by department, ranging from 0.9‰ to 2.6‰ for men and from 0.9‰ to 1.5‰ for women (5th and 95th percentiles) (xls format and pdf format).
Colorectal cancer detection rates for men
Colorectal cancer detection rates for women
The detection rates for advanced adenomas and colorectal cancers depend heavily on the departmental incidence of cancer and the performance of departmental programs in detecting these lesions. Indeed, the percentage of eligible individuals who undergo a colonoscopy following a positive test and the percentage of individuals for whom the managing facility lacks a final diagnosis (lost to follow-up or final diagnoses unknown) are factors that influence the recording of these lesions and may help explain departmental disparities. Furthermore, as defined in the "Guide to Data Format and Definitions of National Program Evaluation Indicators" [guide8], advanced adenomas are adenomas 10 mm or larger in size, with villous or tubulo-villous components, or with high-grade dysplasia. The lack of intra- and inter-examiner reproducibility in the diagnosis of advanced adenomas may also help explain the departmental differences in observed rates of advanced adenomas[1].
[1] Denis, B., Bottlaender, J., Breysacher, G., Chiappa, P., Peter, A., Weiss, A.-M. The advanced adenoma: A topical concept but an out-of-date definition? (2011) Hepato-Gastro, 18 (3), pp. 269-276.
Indicators of detected cancers
The stage of cancers detected by the organized screening program was determined according to the TNM classification system for malignant tumors[1]. Since this classification applies only to carcinomas of the colon and rectum, only cancers histologically classified as "adenocarcinoma" are described in this section. For colon cancers, the pTNM histopathological classification was used. For rectal cancers, which may undergo neoadjuvant treatments prior to surgery—resulting in a change in the T, N, or M stage of the detected tumor—the quality of available data and the heterogeneity of methods for documenting staging information do not allow for the determination of the pre-treatment TNM stage. Consequently, only colon cancers (including the rectosigmoid junction) and rectal cancers that did not receive neoadjuvant therapy were included.
The cancer stage is considered unknown when at least one of the T, N, or M data points is unknown (unless pT=Tis, in which case the TNM stage is in situ, or unless M=M1, in which case the TNM stage is IV). Among the detected adenocarcinomas of the rectum (without neoadjuvant treatment) and colon, this information is missing in 25.5% of patients. This percentage of adenocarcinomas of unknown stage observed at the national level reflects significant regional variation: it ranges from 0% to 100% (xls format and pdf format), as information on the metastatic status of detected cancers is difficult to access.
The description covers only the 53 departments with less than 30% missing data on cancer stages, corresponding to 3,679 detected adenocarcinomas of the colon and rectum (without neoadjuvant therapy). Among these adenocarcinomas, 9% are of unknown pTNM stage.
Among adenocarcinomas with known stages, 25.7% are carcinomas in situ and 74.3% are invasive cancers (stages I to IV), of which 35.9% are stage I, 25.4% are stage II, 26.5% are stage III, and 12.2% are stage IV (xls format and pdf format).