
Participation rates in the organized colorectal cancer screening program, 2016–2017
Reminder: The guaiac test (Hemoccult® II) was replaced by the immunological test (OC Sensor®) in April 2015. Participation rates, calculated for 2016 and 2017 for all French departments, are presented here, along with exclusion rates and the percentages of positive tests.
Materials and Methods
The specifications for cancer screening programs published in the Official Journal on December 21, 2006 (Appendix to No. 295) stipulate that individuals aged 50 to 74 must be invited to undergo colorectal cancer screening every two years. The method for calculating the indicators is based on the data format guide and definitions of indicators for the evaluation of the national program (see Data Format Guide). The indicators are thus calculated over a two-year period, during which the entire population of a department is invited to participate in screening.
Calculation of the Participation Rate
The participation rate is the ratio of the number of people screened to the eligible population, i.e., the screening target population (men and women aged 50 to 74) from which those excluded from screening for medical reasons are subtracted. It is defined as:
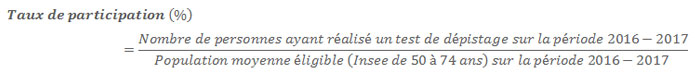
The number of people screened—that is, men and women aged 50 to 74 who underwent a screening test during the evaluation period (here, from January 1, 2016, to December 31, 2017)—and the number of people excluded from screening for medical reasons are provided by the administrative bodies. The definition of medical exclusions is specified in the specifications (see above).
The average eligible population is obtained by calculating the arithmetic mean of the INSEE target population of people aged 50–74 for the calendar years 2016 and 2017, from which the average number of people aged 50–74 excluded from the program for medical reasons during those two calendar years (2016 and 2017) must be subtracted.
Note: For the purpose of comparing departments, the INSEE target population used to calculate participation rates is derived from population data provided by INSEE (2007–2042 projections, central scenario) calculated identically across the entire country.
Calculation of the exclusion rate
The exclusion rate is the ratio of the number of people excluded (temporarily or permanently) from the organized colorectal cancer screening program (see above) to the INSEE target screening population (men and women aged 50 to 74).

The number of excluded individuals is provided by the administrative bodies based on a variety of usable data sources: responses from invited individuals, files of colonoscopy procedures reimbursed by primary health insurance funds, files of diagnostic and therapeutic procedure codes, standardized reports of colonoscopy results and anatomopathological examinations…), but access to which varies depending on the administrative units.
As with the calculation of the participation rate, the average eligible population is obtained by taking the arithmetic mean of the INSEE target population of people aged 50–74 for the calendar years 2016 and 2017, from which the average number (arithmetic mean) of people aged 50–74 excluded from the program for medical reasons during the two calendar years (2016 and 2017).
Calculation of the percentage of positive tests
This is the ratio of the number of people with a positive test result to the number of people with an analyzable test result, i.e., a test that could be read by the screening test reading centers.
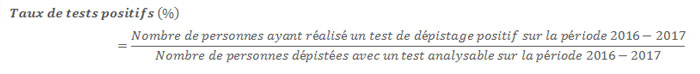
This information is provided by the administrative units.
Age groups
A breakdown into 5-year age groups was used.
The 50–54 age group includes individuals who turned 50 during the year under review, even if they had not yet reached that age at the time of screening; the 70–74 age group includes individuals who had turned 75 at the time of screening, to account for the time lag in test completion for those invited at age 74.
Standardization of indicators
Participation rates, exclusion rates, and the rate of people with a positive test result are calculated by department, by region, and for France as a whole. They are standardized by age and sex relative to the 2009 French population (INSEE projection 2007–2042, central scenario). This standardization allows, by applying the same age and sex structure (that of the 2009 French population) to geographic units, for comparing results across these territories (departments or regions) and for studying changes over time in the various indicators examined.
Benchmarks
The European benchmark recommends a participation rate of the target population of at least 45% for the screening program to be cost-effective.
Results
Participation
Over the period from January 1, 2016, to December 31, 2017, the population eligible for the program is estimated at 16.8 million people aged 50 to 74. Nearly 5.6 million people underwent an immunological screening test, representing a participation rate of 33.5%, an increase of 4.9 percentage points compared to the 2015–2016 period (immunological test: 28.6%) (see tables in PDF and Excel formats). This rate remains below the acceptable European benchmark of 45%1.
Participation, which had been declining slightly since 2010–2011—falling from 32.1% to 29.8% in 2013–2014—dropped sharply to 23.1% in 2014–2015, then increased during the 2015–2017 period (Graph). The sharp decline observed is due to the interruption of organized screening activities in late 2014 and early 2015 (suspension of invitations in the last quarter of 2014 and launch of the immunological test in April 2015).
The participation rate is higher among women than among men (32.1% versus 34.7%, respectively; see tables in PDF and Excel formats), regardless of age group (see tables in PDF and Excel formats). It increases with age among men, from 28.1% among those aged 55–59 to 39.5% among those aged 70–74, and among women, from 33.3% among those aged 55–59 to 38.1% among those aged 70–74.
There is a regional disparity in participation rates (see Map 1, Map 2, and tables in PDF and Excel formats). Rates are particularly low (<25%) in the departments of Corsica, French Guiana, Ardèche, Paris, Lozère, Ariège, Alpes-Maritimes, and Hérault. The highest rates are found in Saône-et-Loire (47.3%) and Ille-et-Vilaine (50.6%), two departments where the antibody test is sent on an experimental basis directly to individuals invited during the second follow-up. The other departments with rates of 45% or higher are Haut-Rhin (45.6%) and Maine-et-Loire (44.7%). In total, 57 departments have a participation rate higher than the national average (33.5%).
Exclusion
Medical exclusions must be regularly reported and be as comprehensive as possible to ensure the quality of the program. They may be either permanent for medical reasons (personal or family history of adenomas or colorectal cancer, familial adenomatous polyposis, chronic inflammatory bowel disease, hereditary non-polyposis colorectal cancer, or Lynch syndrome), or temporary due to symptoms or having undergone a colonoscopy within the past five years with normal results.
Over the 2016–2017 period, the exclusion rate was 12.9%, corresponding to nearly 2.5 million people excluded (see tables in PDF and Excel formats). It is slightly lower among men than among women (12.8% versus 13.0%, respectively). It increases significantly with age, from 6.0% among men aged 50–54 to 22.0% among men aged 70–74, and from 7.0% to 19.7% among women, respectively (see tables in PDF and Excel formats).
There are significant regional disparities in exclusion rates, ranging from less than 5% in Bouches-du-Rhône and French Guiana to 23.1% in Bas-Rhin (see Map 3 and tables in PDF and Excel formats). These regional disparities highlight the inconsistencies in the quality of data collection across departments. The number of excluded individuals remains poorly documented in certain departments, particularly due to the poor performance of their systems for collecting data on medical exclusions. At the departmental level, there is a variety of usable data sources to document medical exclusions, but these are not always accessible to administrative bodies. This situation highlights the need to optimize the collection of information on medical exclusions to ensure the program’s quality, by defining a national strategy to better guide and support the professionals involved.
Positive tests
As a reminder: the positivity threshold used is greater than or equal to 30 µg/g of stool (or 150 ng/ml of buffer), corresponding to an expected positivity rate in the French population of approximately 4%.
Over the 2016–2017 period, 5.6 million people took a test, of whom nearly 248,000 tested positive, representing a positivity rate of 4.5%. This rate is higher among men than among women (5.5% vs. 3.5%) and increases with age (see graph and tables in PDF and Excel formats).
There is significant variation in the positive test rate across departments, ranging from 4% in Guadeloupe, the Hautes-Alpes, and French Guiana to 9.6% in Hérault (see map) among men, and from 2.9% in Savoie, Aveyron, and Loire-Atlantique to 6.8% for Hérault (see map) among women (see tables in PDF and Excel formats).
Conclusion
Between 2016 and 2017, nearly 2.5 million people aged 50 to 74 were excluded from the program, and 5.6 million underwent a screening test, representing a participation rate of 33.5%. The rate of people with a positive immunological test result is 4.5%, in line with expectations. Participation has increased slightly compared to the previous period. The next participation data will cover the 2017–2018 period, i.e., a period of routine screening organization, and should allow for a better assessment of the potential impact of the change in testing on participation.